
Figure 5.
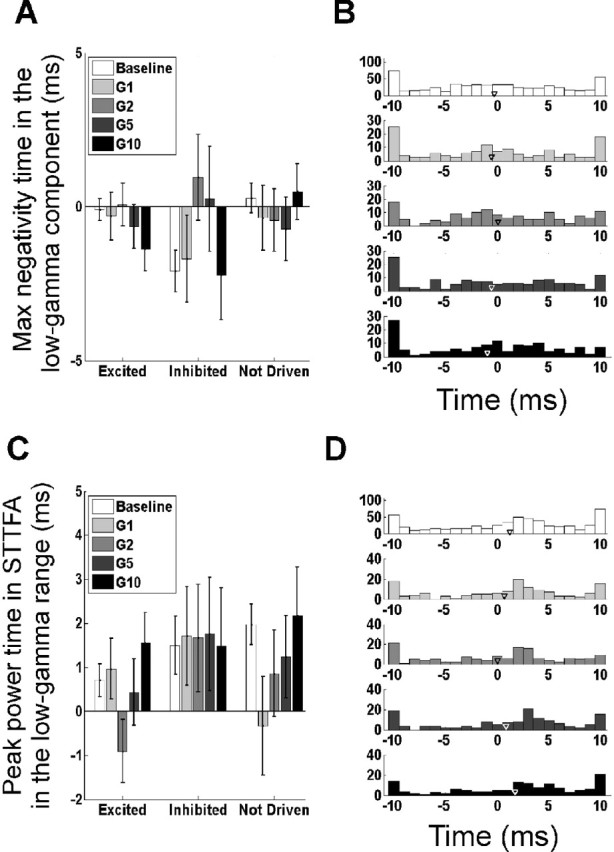
Changes in low-gamma phase with stimulus amplitude. A, Time of the peak negativity in the low-gamma component (as described in Fig. 3D) for the three different neuron types at baseline and four different stimulus intensities. B, Histogram of times at which the peak negativity was observed in the low-gamma component. The histograms of the three neuron types were similar; hence, the data were pooled. C, Time at which the low-gamma energy in the STTFA (computed by averaging the energy between −5 and 10 ms and between 40 and 60 Hz) is highest (same panel configuration as in A). D, Histogram of the peak power times as described in C (same panel configuration as in B). Error bars indicate SEM.