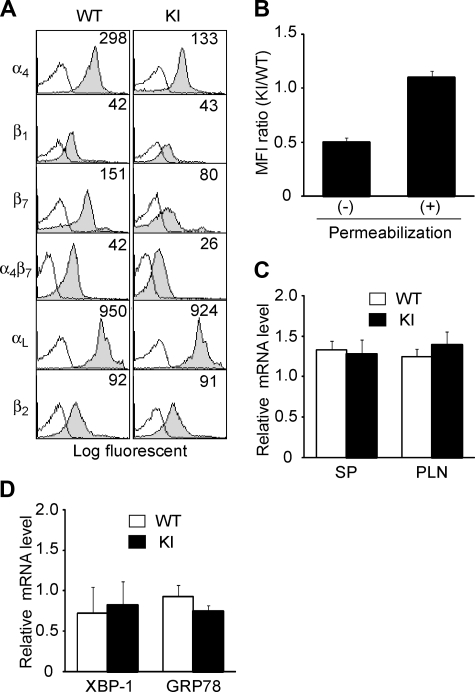
Figure 2.
Expression of integrins in α4-R/AGFFKR mice. (A) Cell-surface expression of integrins on splenic lymphocytes from wild-type (WT) and α4-R/AGFFKR (KI) mice. Numbers denote mean fluorescent intensity (MFI). Background binding of isotype control antibodies is shown with open histograms. (B) Cell-surface and total (cell surface plus intracellular) α4 protein expression in WT and KI splenocytes. Expression of α4 integrins was measured by immunofluorescent cytometry in the absence (for cell-surface expression) or presence (for total expression) of permeabilization treatment. Ratios of MFI values are shown. (C) α4 mRNA expression in spleen (SP) and peripheral lymph node (PLN) cells. (D) mRNA expression of GRP78 and the spliced form of XBP-1, markers to probe levels of UPR in WT and KI splenocytes. (C,D) mRNA expression was measured by a quantitative RT-PCR and normalized by GAPDH mRNA levels. (B-D) Data represent the mean plus or minus SEM of at least 3 independent experiments.

