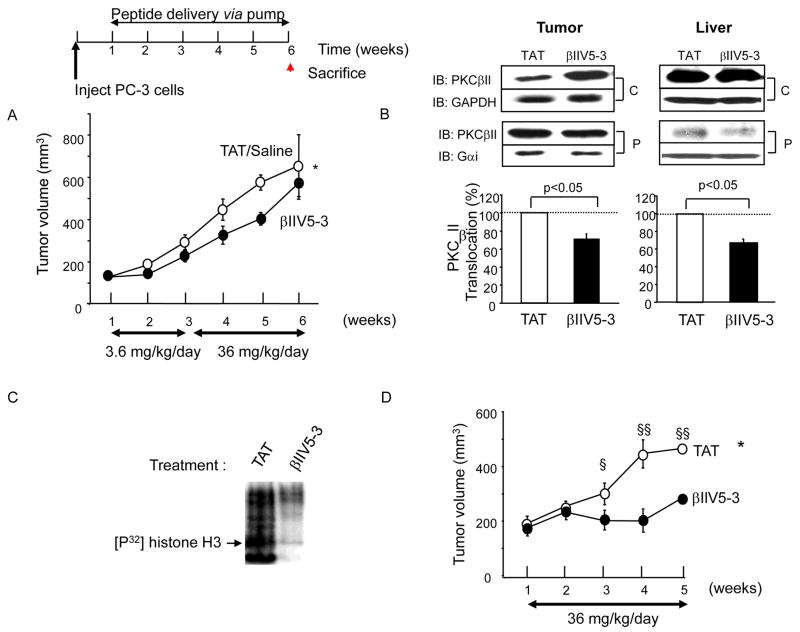
Figure 3.
PC-3 tumor growth rate was reduced with PKCβII-specific inhibitor treatment. One week after PC-3 cell injection, mice were implanted with osmotic pumps with saline, control peptide (TAT) or βIIV5-3 conjugated to TAT at 3.6 mg/kg/day for 2 weeks followed by 36 mg/kg/day for the next 3 weeks. Deuterated water (4%) was administered for 1 week prior to sacrifice. (A) Tumor volume was measured weekly (repeated ANOVA, *; p<0.05, n=4–5 each). Tumors were excised and weighed at week 6. Final tumor weight was 40% lower in the βII V5-3-treated group but this difference did not reach statistical significance and there was no difference in body weight between the groups. (B) Five-week continuous βIIV5-3-treatment decreased PKCβII translocation to the particulate fraction of both tumors and livers. The active level of PKCβII was analyzed by Western blot after fractionation. GAPDH and Gαi were used as loading controls for the cytosolic (C) and particulate (P) fractions, respectively. IB; immunoblot. A 2-tailed Student’s t test was used to determine significance (n=3 each, p<0.05). (C) βIIV5-3 treatment in vivo results in reduced PKC kinase activity as measured in vitro, following immunoprecipitation with anti-PKCβII antibodies. Kinase assay was performed in the absence of added PKC activators, using histone (H3) as a substrate as described (30). The film was exposed for 3 days in −80C°. (D) A greater decrease in PC-3 tumor growth rate was obtained with a higher dose of βIIV5-3 (36 mg/kg/day for 4 weeks). A repeated ANOVA and a 2-tailed Student’s t test was used to determine significance (*; p<0.05 in repeated ANOVA, §; p<0.05 vs. TAT-treated and §§; p <0.005 vs. TAT-treated in t test, n=8–9 each, 16% vs. 60% reduction in the overall tumor growth rate, Figure 3A vs. 3D). Additional blots for (B) and (C) are provided in supplemental Figure 3.

