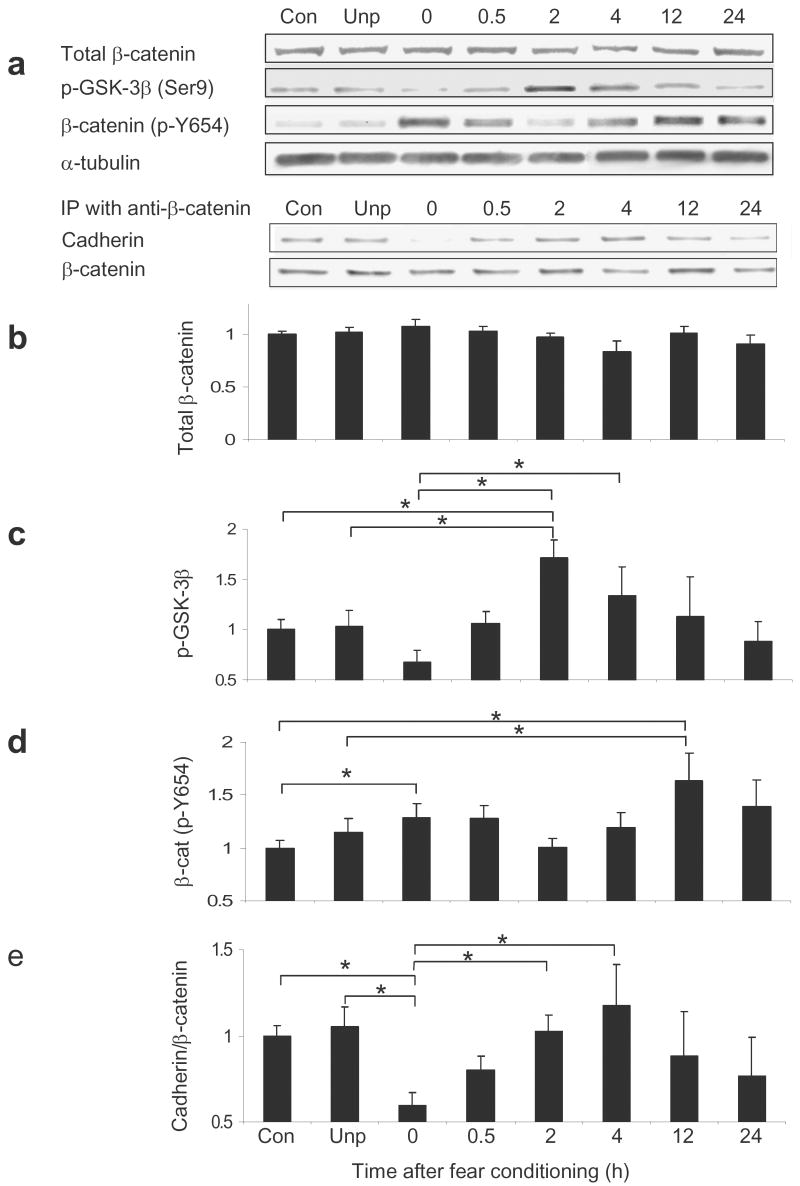
Figure 3. Phosphorylation state of β-catenin and GSK-3β are altered following fear conditioning.
Animals were exposed to five tone-shock pairings and then sacrificed 0, 0.5, 2, 4, 12, or 24 hr after training. (a) Qualitative representation of western blot data. In all bar graphs quantitative levels of proteins determined with western blots are expressed relative to the α-tubulin loading control. (b) Total levels of β-catenin, determined by western blot, do not change with fear conditioning. (c) Phospho-GSK-3β levels are significantly changed across timepoints. (d) β-catenin (phospho-Y654) levels are significantly changed across timepoints. (e) Immunoprecipitation results from a cadherin immunoblot after β-catenin immunoprecipitation. Cadherin interaction with β-catenin is significantly changed across timepoints. (n = 31 for context; n =13 for unpaired, n = 14 for 0 hr, n = 27 for 0.5 and 2 hr, n = 8 for 4 hr, n = 6 for 12 hr, and n = 7 for 24 hr; ‘con’ = context control group, ‘unp’=unpaired shock control group; Bars indicate mean ± s.e.m.; * denotes P ≤ 0.05 for the different comparisons identified).

