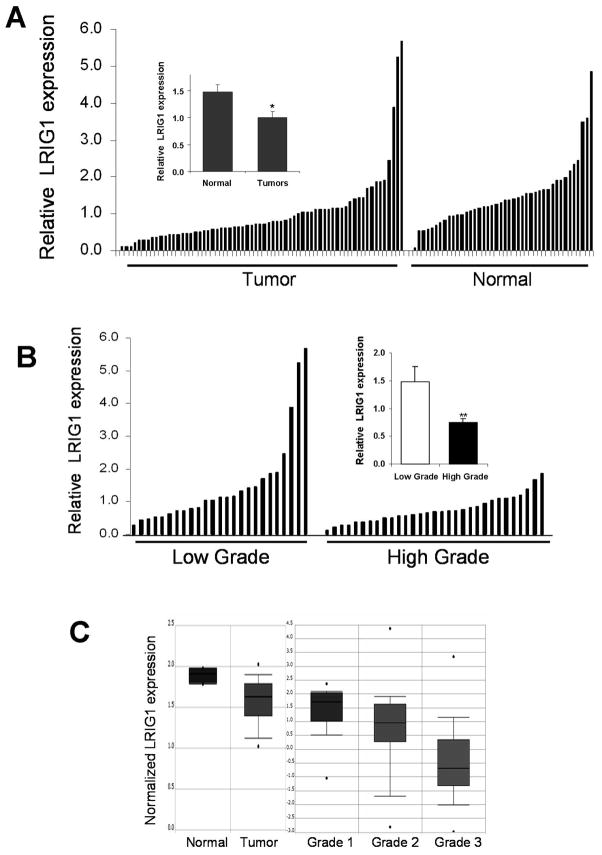
Figure 2.
LRIG1 levels are decreased in human breast tumors. A, Relative LRIG1 expression was compared in breast tumor and normal specimens via western blot analysis. Each of the 67 tumor and 42 normal samples are plotted in order of increasing LRIG1 levels after normalizing to actin levels. Inset, The mean value of LRIG1 protein expression for each subset is plotted with error bars showing SE. B, Using the Richardson-Bloom grade information available from the pathology reports of 58 of the 67 tumors, relative LRIG1 expression of each tumor is plotted as a function of the tumor grade. Low grade represents tumor grades of 1 and 2, with high grade corresponding to grade 3 tumors. Inset, The average LRIG1 level of each grouping is plotted in the right panel with error bars showing the SE. C, Representative plots of normalized LRIG1 transcript in breast tissue from the Oncomine database are pictured. Each study has a P value of < 0.05.

