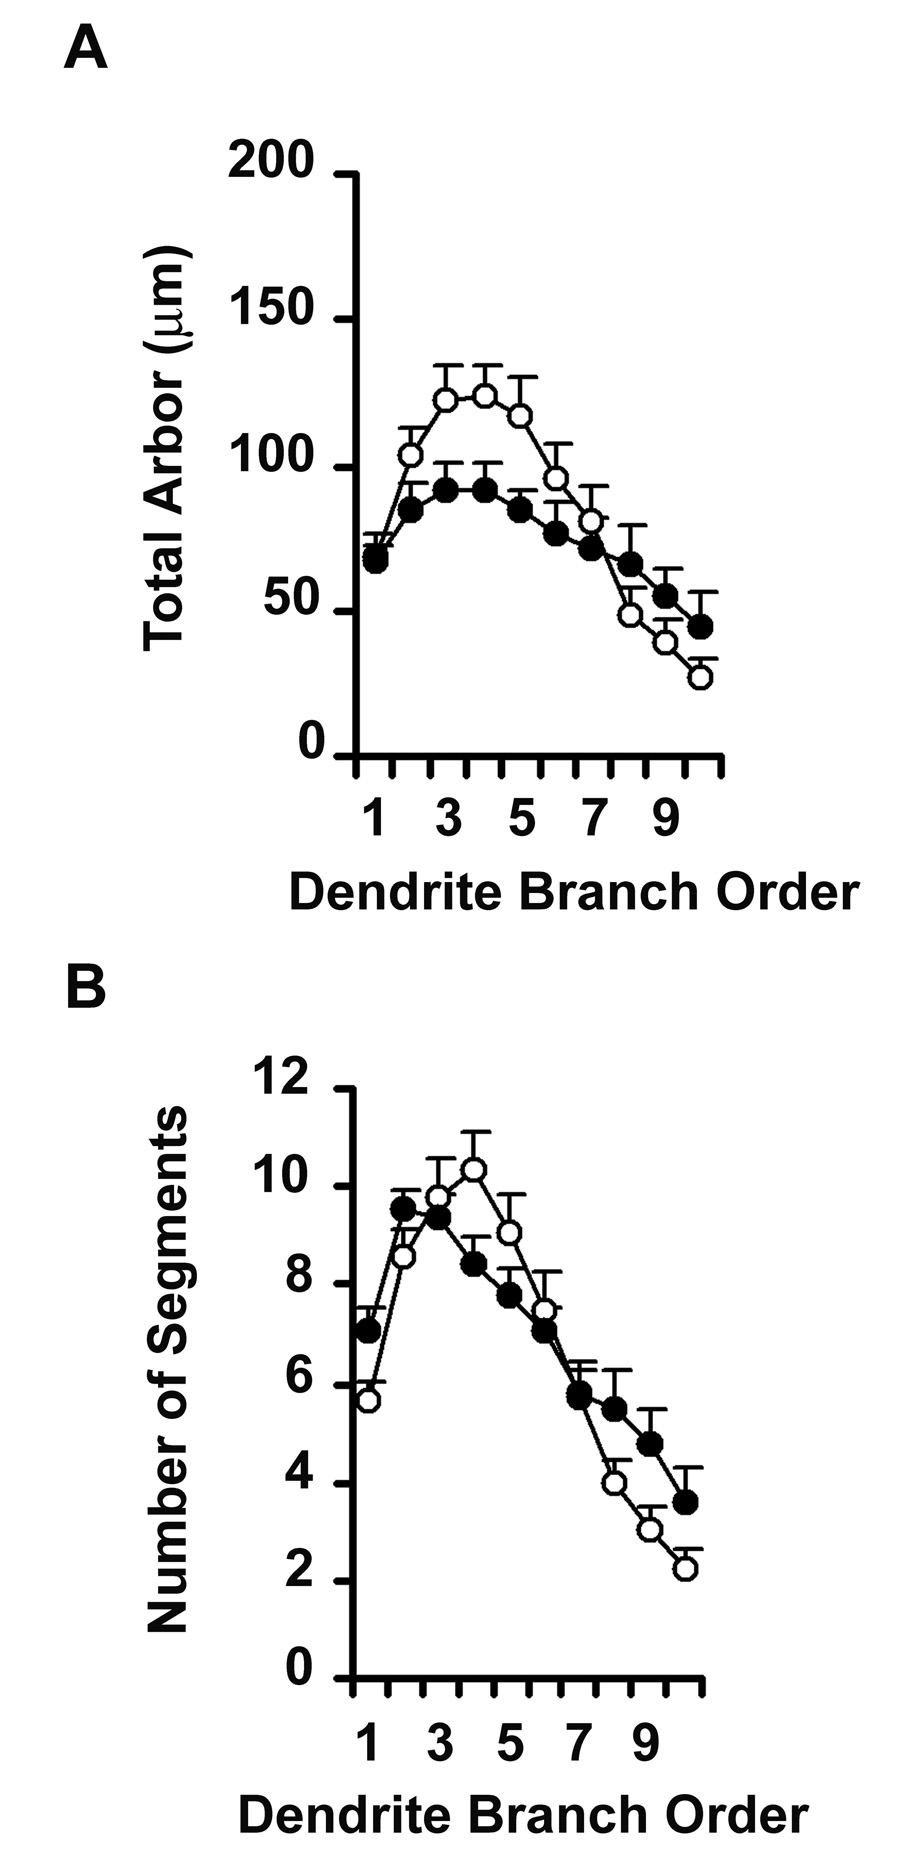
Figure 6.
Line graph representing AP5 mediated changes in dendrite morphology along the length of the dendritic tree, as a function of branch order. Unfilled circles represent GFP-transfected control neurons while filled circles represent neurons treated with 100µM AP5. Repeated Measures ANOVA showed no significant differences in (A) the total amount of dendritic arbor (F1,49 = 1.886; p = 0.1760) or in (B) the number of dendritic segments (F1,49 = 0.251; p = 0.6186) of AP5 treated neurons, but revealed a significant change in the distribution of dendritic arbor (Group × Order, F9,441 = 2.224; p = 0.0197) and in the number of dendritic segments (Group × Order, F9,441 = 3.650; p = 0.0002) across the dendritic tree.

