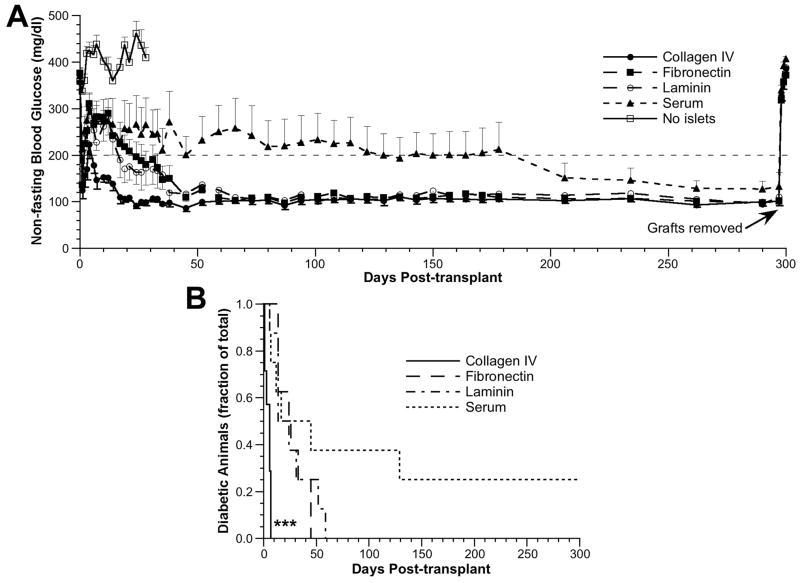
FIGURE 2.
Glucose regulation after islet transplantation. (A) Nonfasting blood glucose levels from day 0 (day of transplant) through day 300 posttransplant. ●, collagen IV group (n=7); ■, fibronectin group (n=8); ○, laminin group (n=8); ▲, serum group (n=8); □, no islet group (n=8). Data are presented as mean glucose level±SEM (one-sided error bars used for clarity). (B) The fraction of diabetic animals that converted to euglycemia over time for scaffolds coated with collagen IV (solid line), fibronectin (dashed line), laminin (dash-dot line), and serum proteins (dot-dot line). ***P<0.001, collagen IV vs. all other conditions.

