
Figure 1.
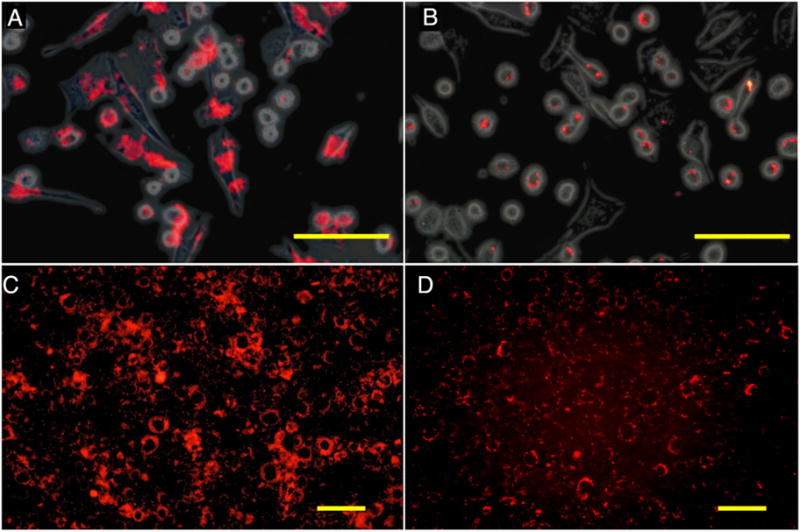
Fluorescence microscopy of cationic (A,C) and anionic (B,D) PFCE-labeled C17.2 mouse NSCs after 4 hours of incubation with 2.4 mM PFCE. (A,B) Rhodamin (red) on and phase contrast overlay image of cells immediately after 4 hours of incubation. (C,D) Rhodamin fluorescent images of cells cultured for an additional 18 hours following removal of PFCE at 4 hours of incubation. Note the transport and intracellular redistribution of label between the two time points. Size bar=100 μm in (A,B) and 50 μm in (C,D).