
Fig. 1.
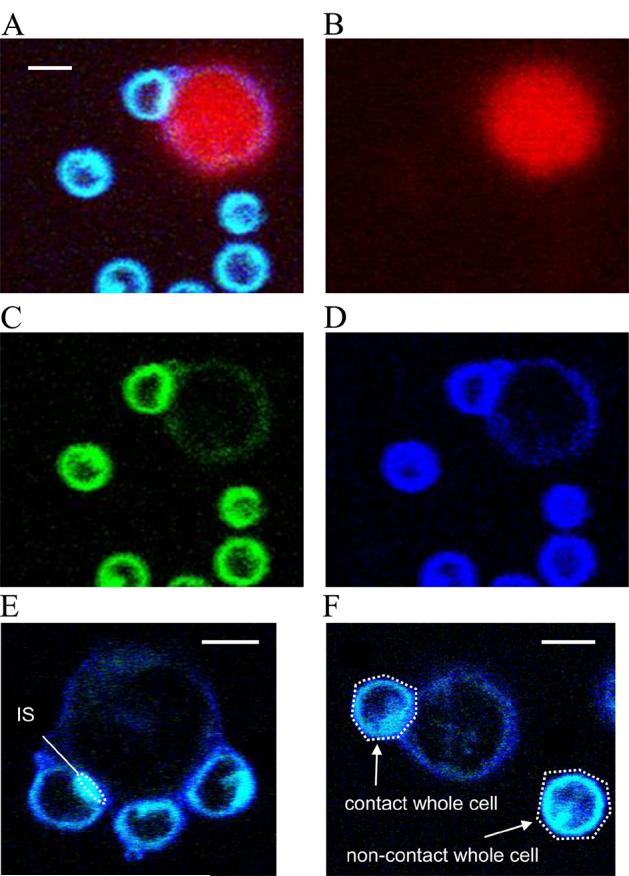
Representative two-photon microscopy images of the Laurdan labeled T cells. 8-bit TIFF format captured images were analyzed in (A) RGB, (B) red (CMTMR), (C) green (I470-530) or (D) blue (I400-460) channels, respectively. Regions of interest (ROI) at (E) T cell immune synapse, (F) contact whole cell and non-contact whole cell were selected by drawing an oval or polygon as shown in white dotted lines. Mean intensities from blue and green channels were recorded to calculate GP-values as described in the Methods. Scale bar, 5 μm.