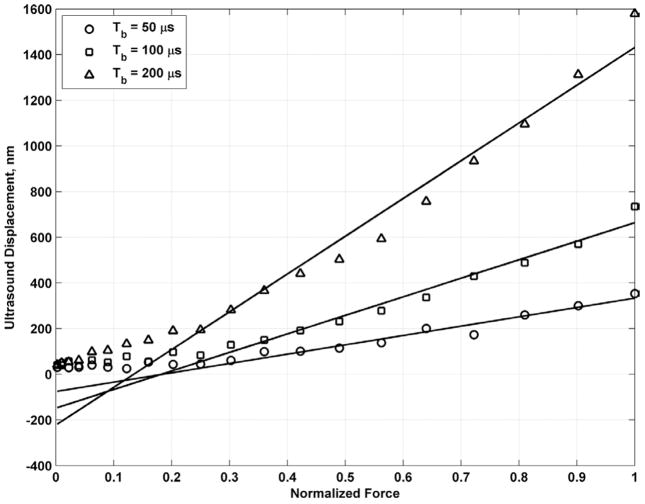
Fig. 15.
Regression of measured ultrasound displacement versus normalized force for different values of Tb in bovine muscle section. The regression line for Tb = 50 μs was computed for the 9 highest samples and the resulting equation is y50 = 409.0482x − 75.0306 with R2 = 0.9417. The regression line for Tb = 100 μs was computed for the 11 highest samples and the resulting equation is y100 = 811.5938x − 147.3434 with R2 = 0.9761. The regression line for Tb = 200 μs was computed for the 13 highest samples and the resulting equation is y200 = 1653.9x − 222.1 with R2 = 0.9721.

