
Figure 2.
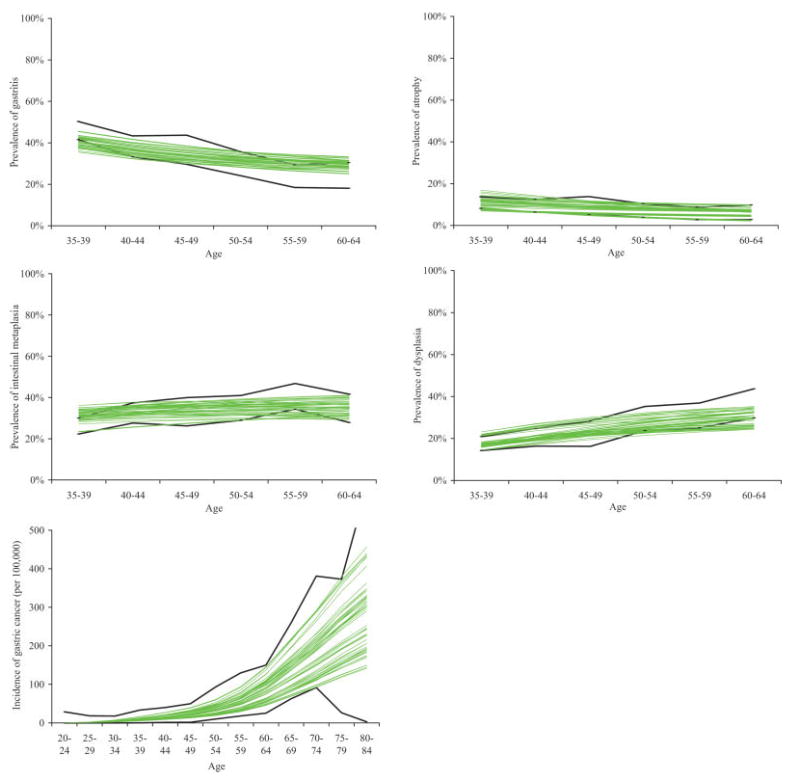
Comparison of model output to epidemiologic data on prevalence of precancerous lesions and gastric cancer incidence for 50 good-fitting parameter sets for men. Model output for precancerous lesions prevalence are depicted in the top rows and for gastric cancer incidence in the bottom row. Bold lines indicate 95% confidence intervals of age-specific prevalence or incidence data. Non-bold lines depict model output for 50 randomly-selected good-fitting parameter sets. [Color figure can be viewed in the online issue, which is available at www.interscience.wiley.com.]