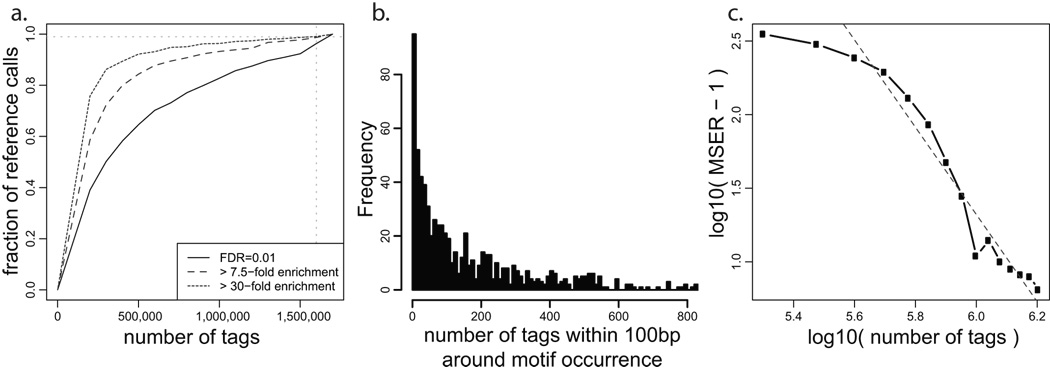
Figure 6. Analysis of sequencing depth.
a. Given the NRSF binding positions determined using complete dataset (y-axis), the black curve shows the fraction of positions that can be predicted (within 50bp) using smaller portions of the tag data (x-axis). All of the binding predictions are generated using FDR of 0.01 using the WTD method. The curve does not reach a horizontal asymptote, indicating that the set of detected NRSF binding sites has not stabilized at the current sequencing depth. The additional curves limit the analysis to binding positions whose fold enrichment ratio over the background is significantly (P<0.05) higher than 7.5 (MSER: Minimal Saturated Enrichment Ratio, dashed line) and 30 (dotted line). The observed enrichment ratios are evaluated independently for each tag subsample (x-axis). b. Distribution of tag counts around high-confidence NRSF motif positions. Positions with zero tags were not included. c. The relationship between MSER of the detected binding positions and sequencing depth (expressed as a fraction of the complete dataset). The dashed gray line shows a log-log model that can be used to estimate the sequencing depth required to saturate detection of binding positions with lower fold-enrichment ratio. By that estimate, 1.2×10⁶ more sequence tags would be necessary to saturate detection of binding positions that are two-fold enriched over background (MSER=2 corresponds to y=0, at which the red line crosses x-axis: x=2.8×10⁶).

