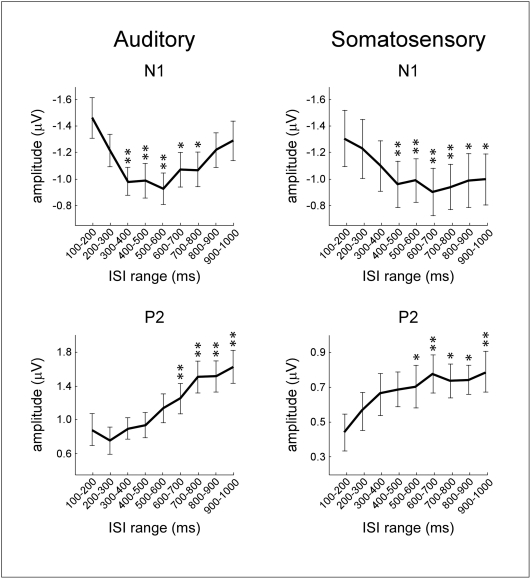
Figure 4. Effect of inter-stimulus interval (ISI) on the somatosensory N1 and P2 waves.
Trials were classified according to ISI, yielding nine categories ranging from 100 to 1000 ms in steps of 100 ms. Response overlap was corrected using the Adjacent Response procedure [35] (see Methods). The middle panel displays the somatosensory ERP obtained at each ISI category (group-level average; P3 vs. average reference). Each ISI category is colour coded. x axis, time (ms); y axis, amplitude (µV). Upper and lower panels display the N1 and P2 waves and their scalp distributions, separately for each ISI. Note the opposite effect of ISI on the amplitude of the somatosensory N1 and P2 waves: at very short ISIs, the N1 displays significantly larger amplitudes, while the P2 displays significantly smaller amplitudes.

