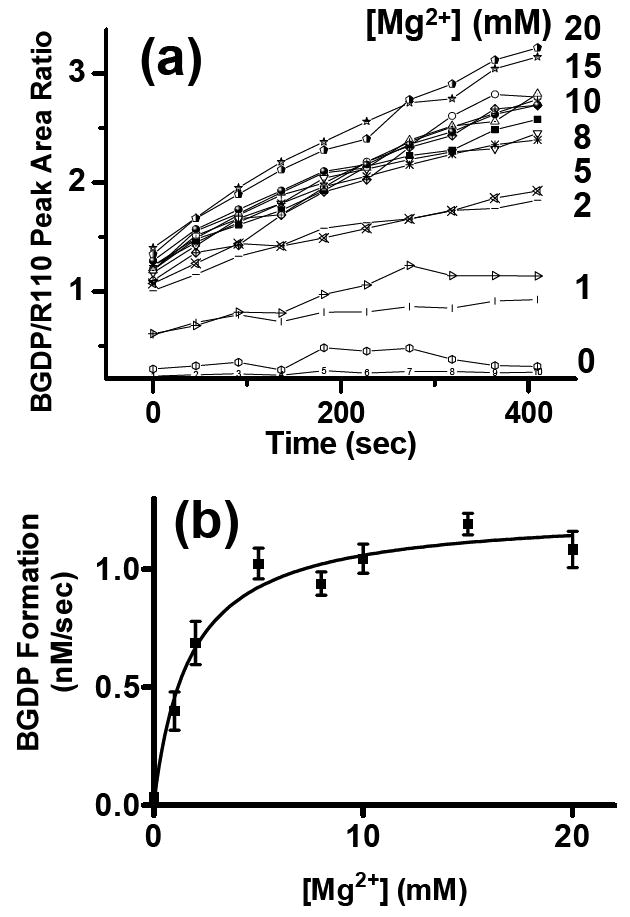
Figure 3.

Optimizing enzyme conditions. (a) BGDP peak heights recorded by serial electrophoresis from 16-channels when BGTP was hydrolyzed by Gαo at various Mg2+ concentrations. Each sample reservoir was filled with a solution of 83.3 nM Gαo, 1 μM BGTP, and 21.8 nM R110 in TGE buffer spiked with Mg2+ concentrations as shown. Each Mg2+ concentration was used in two separate channels. BGDP formation was monitored and BGDP/R110 ratios were used to indicate the real-time concentrations of BGDP in the reaction mixtures. (b) Plot showing Gαo hydrolytic activities at different Mg2+ concentrations. Hydrolysis rates indicated by BGDP formation (nM/sec) were derived from linear fitting of Figure 4 (a). The rates were fitted to a one-site binding function versus Mg2+.
