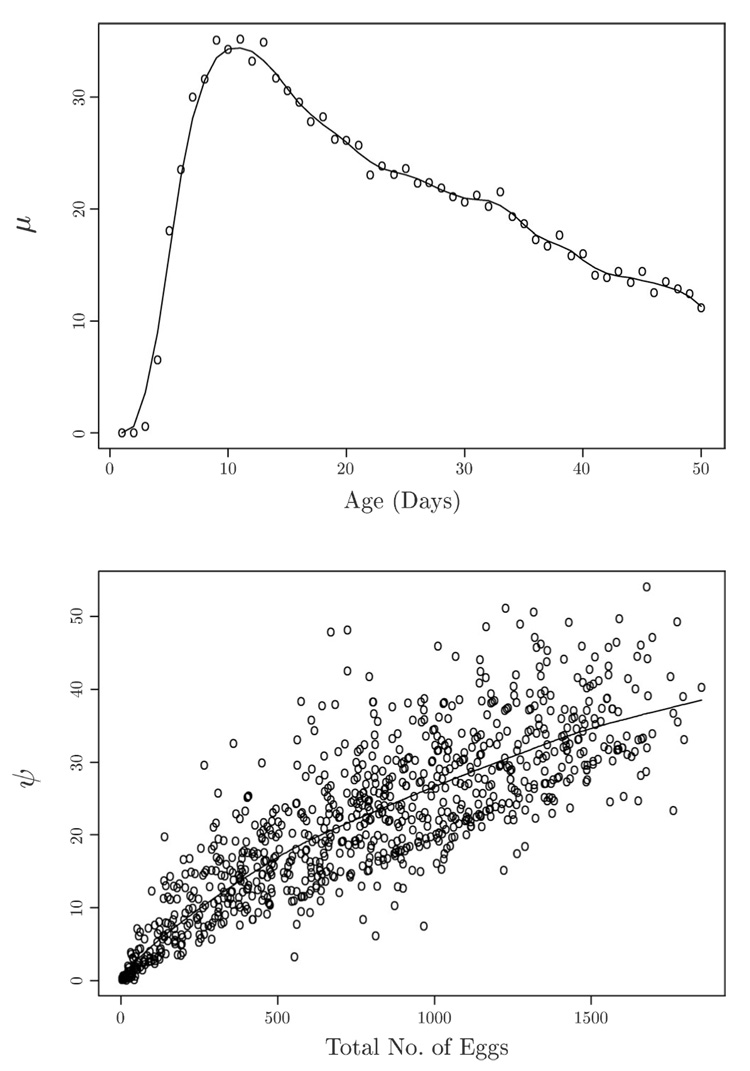
Figure 2.
Scatterplots and function estimates μ̂ (14) (above) for function μ and ψ̂ (15) (below) for function ψ, for the components of the Multiplicative Effects Model (M1), with total number of eggs as covariate. Cross-validated bandwidths are 2.5 days for μ̂ and 502 for ψ̂.

