
Figure 2. Connectivity Z-score plot for one example region of interest (ROI) where there was a significant cluster in the group difference map at time 1 for seed point placed in the left inferior frontal gyrus (IFG) and ROI was placed the right middle frontal gyrus.
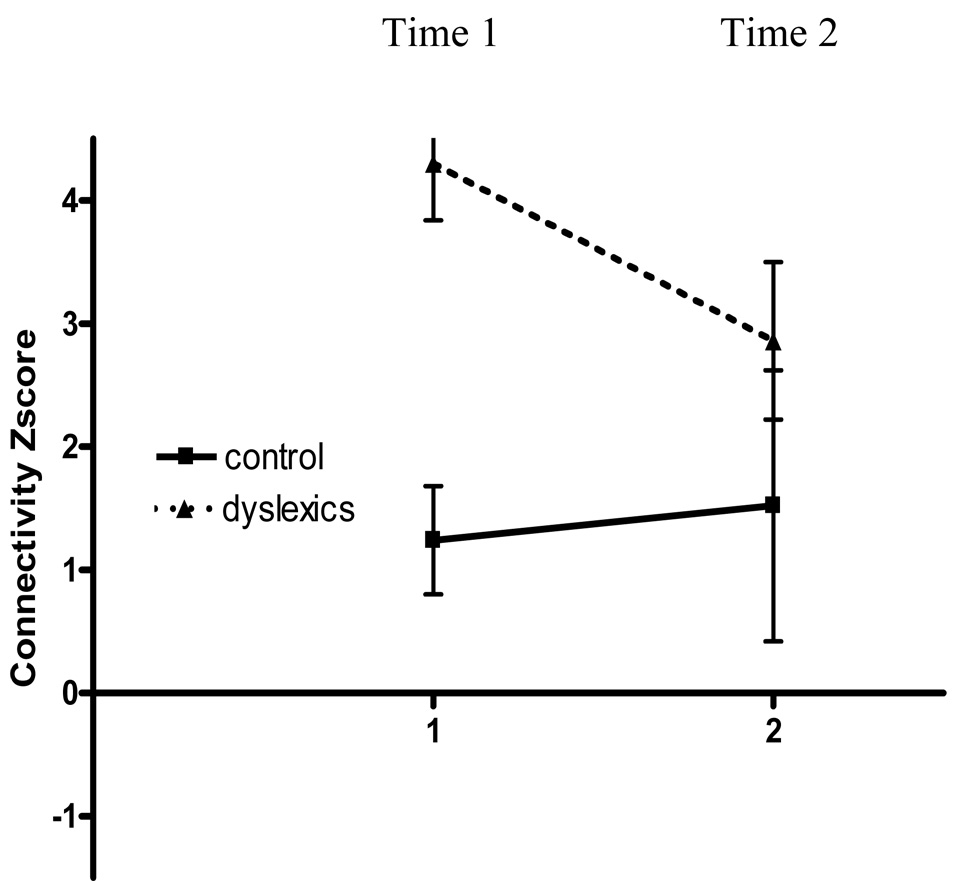
This plot shows that control values are relatively stable over time and that the score for children with dyslexia changes from time 1 (before treatment) to time 2 (after treatment) to become more like the control value. The connectivity Z-score was calculated with FSL FLAME software used to calculate the group maps. Error bars are shown as standard deviation.