
Fig 3.
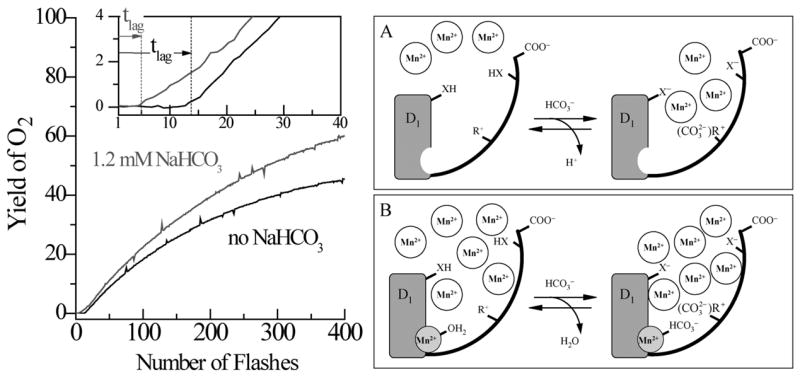
(Left side) Kinetics of reconstitution of O2 evolution capacity by photoactivation of the apo-WOC-PSII membranes in the presence of (1) 0 mM, and (2) 1.2 mM, added bicarbonate. Assay conditions are pH 6.0, 1 μM apo-WOC-PSII, 100 μM MnCl2, 100 mM CaCl2, and 1.8 mM K3Fe(CN)6. The insert expands the first 40 flashes (3 s repetition rate). The vertical dashed lines represent the lag time tlag for each experiment, as derived from fitting the entire kinetics (Baranov et.al. (2004)). (Right side) Two-site model for bicarbonate acceleration of the rate of the first step of photoactivation. (A) The high-affinity bicarbonate site: When the high affinity Mn2+ site is unoccupied at low Mn2+ concentrations ([Mn2+] < 30 μM = KD [61]), (B) The low affinity bicarbonate site: At high Mn2+ concentrations ([Mn2+] > 30 μM = KD), bicarbonate binds directly to the high-affinity Mn2+ binding site (Baranov et.al.)(Dasgupta et al., submitted).