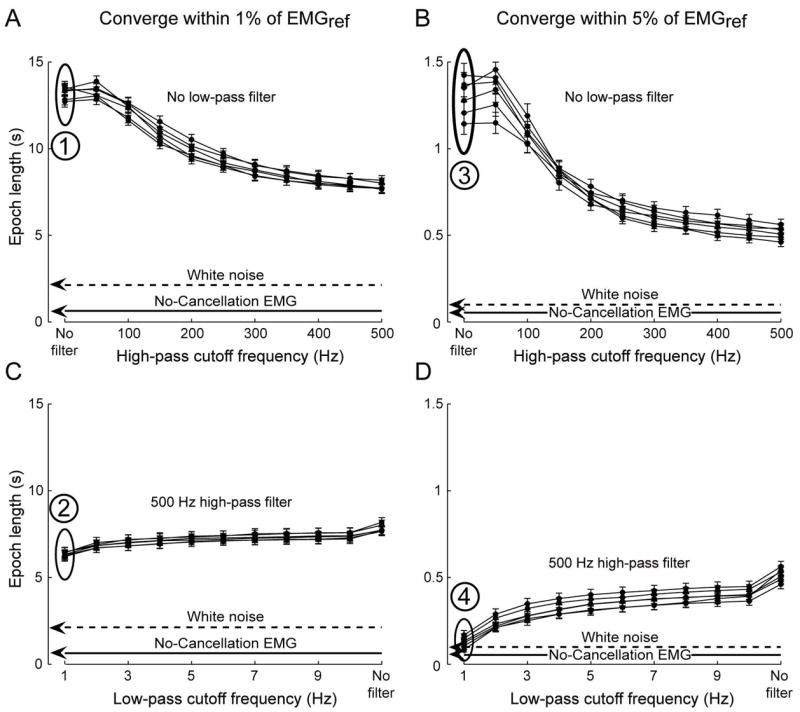
Figure 5.

Combinations of high- and low-pass filtering decrease epochs to estimate EMG amplitude, and approach those from the no-cancellation EMG. Results are shown across all 245 Monte Carlo iterations (mean ± SE) at 6 excitation levels for both criteria used to analyze epochs – a decrease to within 1% (A and C) or 5% (B and D) of EMG amplitude calculated over 28 s, which we used as reference (EMGref.). High-pass filtering with cutoffs > 250 Hz resulted in substantial decreases in epoch lengths (A and B), with low pass filters (C and D) contributing to a lesser extent. Numbers and associated ovals in Figure 5 correspond with the case presented by the same numbers as histograms in Figure 6. Performance of the no-cancellation and white noise signals are shown by lines (means across conditions) for clarity, although filtering was not applied to either signal.
