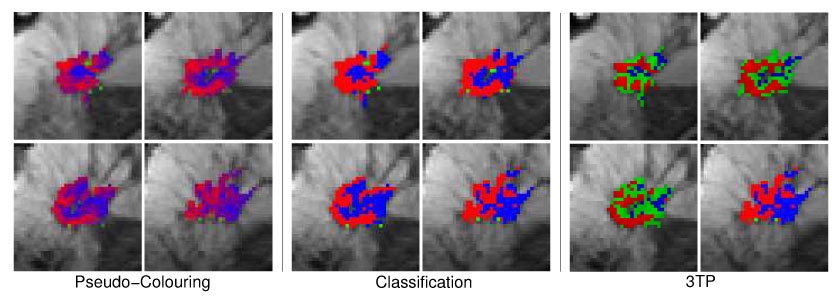
Fig. 10.

Same pseudo-color visualizations as described in Figure 10 but for the malignant lesion M4 (multilocullar ductal carcinoma). All types of pseudo–color visualizations expose the heterogenous structure of the lesion tissue, with malignant tissue areas at the lesion margin and tissue with benign signal characteristics in the core and right part of the lesion.
