
Fig. 12.
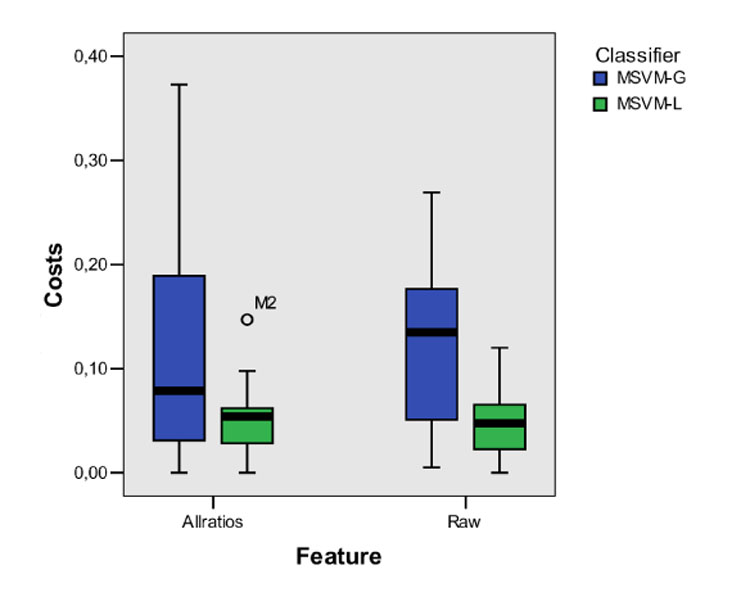
Box plot of the misclassification costs obtained for the MSVM based classification with different feature sets (raw, allratios) and different kernels (MSVM-L, MSVM G). For each combination, the median (bold line), middle half of the sample (color filled box), and extreme values (whiskers) are presented. For the MSVM with linear kernel and allratios-feature, one case deviating more than 1.5 box length from the end of the box is identified as an outlier.