
Fig. 2.
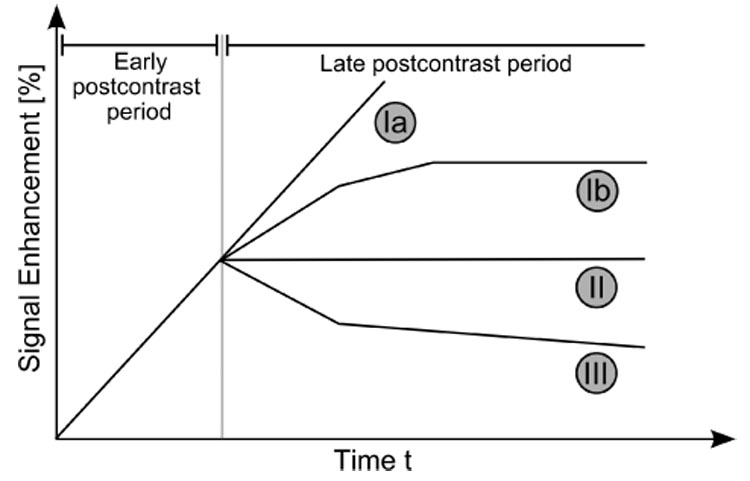
Schematic drawing of the three types of time–series signals according to Kuhl et al. [4]. Type I corresponds to a straight (Ia) or curved (Ib) line; enhancement continues over the entire dynamic study. Type II is a plateau curve with a sharp bend after the initial upstroke. Type III is a washout time course. For visual inspection, the time–series signals are typically displayed as relative-enhancement curves depicting the signal enhancement with respect to the signal intensity in the precontrast image.