
Fig. 4.
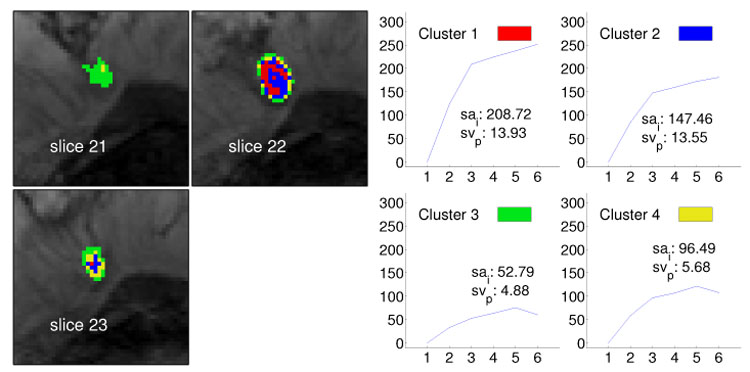
Segmentation method applied to data set B1 (benign lesion, fibroadenoma) and resulting in four clusters. The left image shows the cluster distribution for each slice ranging from 21 to 23. The right image presents for each cluster the representative time–series signal (displayed as relative enhancement curves) and the corresponding quantities initial signal change (sai) and postinitial signal change (svp). The pseudo-color images indicate strong and steady enhancing tissue in the lesion center and weakly enhancing tissue at the lesion border, suggesting an overall benign lesion.