
Fig. 5.
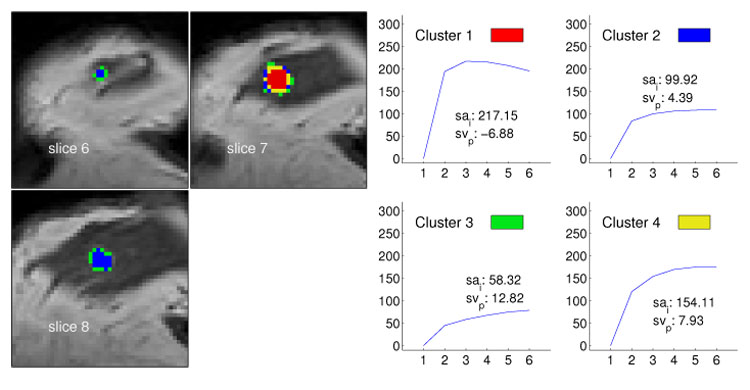
Segmentation method applied to data set M1 (multilocullar recurrent ductal carcinoma) with four clusters. The left image shows the cluster distribution for each slice ranging from 13 to 16. The right image presents for each cluster the representative time–series signal (displayed as relative enhancement curves) and the corresponding quantities initial signal change (sai) and postinitial signal change (svp). The pseudo-color images indicate a lesion core of malignant tissue exposing signals with strong uptake and distinct wash-out characteristics.