
Fig. 6.
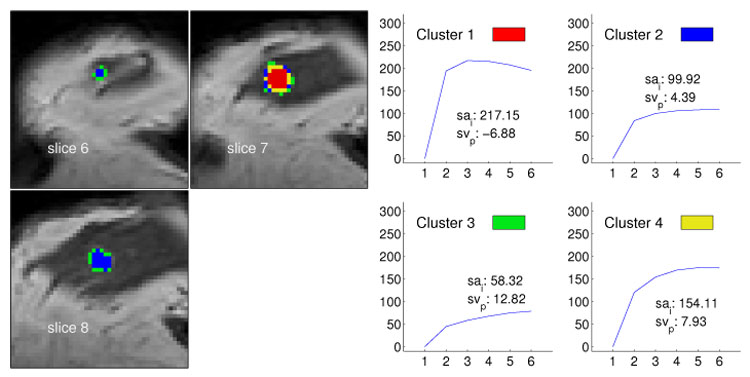
Segmentation method applied to data set M3 (malignant lesion, ductal carcinoma in situ) and resulting in four clusters. The left image shows the cluster distribution for each slice ranging from 6 to 8. The right image presents for each cluster the representative time–series signal (displayed as relative enhancement curves) and the corresponding quantities initial signal change (sai) and postinitial signal change (svp). The pseudo-color images indicate a lesion core of malignant tissue exposing signals with a strong uptake but weak wash-out. Voxels at the lesion margin expose persistently enhancing time–signal intensity curves.