
Fig. 7.
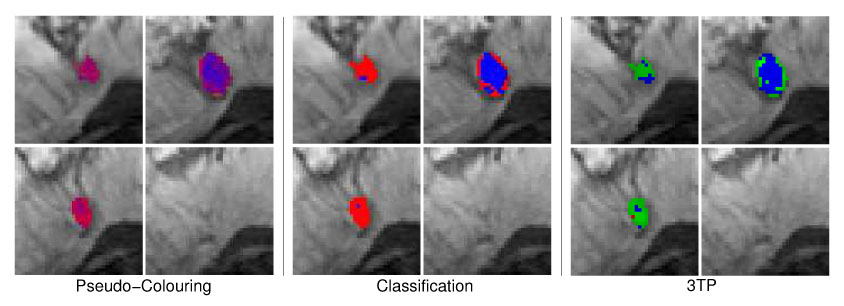
Four different image slice showing the benign lesion B1 (fibroadenoma) with pseudo-colors reflecting the local probability of malignant, benign and normal tissue (left 2 × 2 image matrix) or the local tissue classification as malignant (red), normal (green) or benign (blue) tissue (middle 2 × 2 image matrix). The 3TP based visualization of the lesion is presented in the right 2 × 2 image matrix. Both techniques indicate benign tissue (blue) in the lesion center. Tissue rated as suspicious by 3TP (green) is displayed with shadings of purple and red in the MSVM based visualization, also indicating suspicious signals with no distinct benign or malignant signal characteristics.