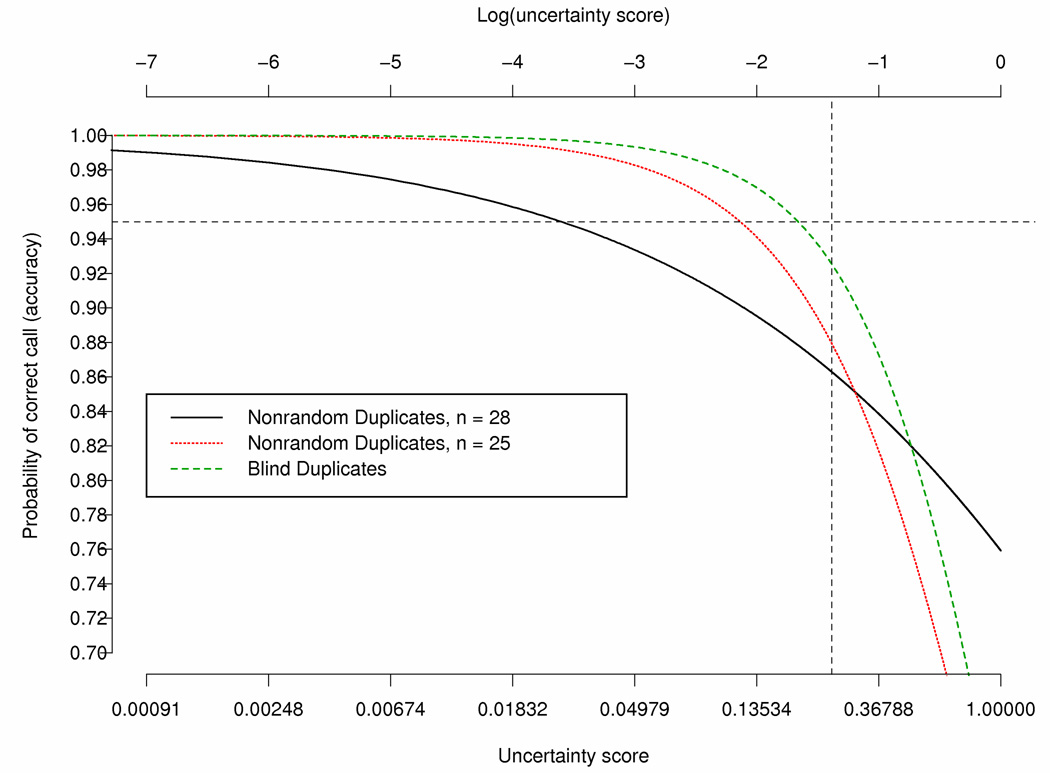
Figure 2.
Predicted Probability of discordancy from logistic regression where the uncertainty score of 1st and 2nd calls are equal for the 28 nonrandom duplicates, the 28 nonrandom duplicates minus e000014, e000211 and e000106, and the 20 blind duplicates. The vertical line indicates an uncertainty score of 0.25.

