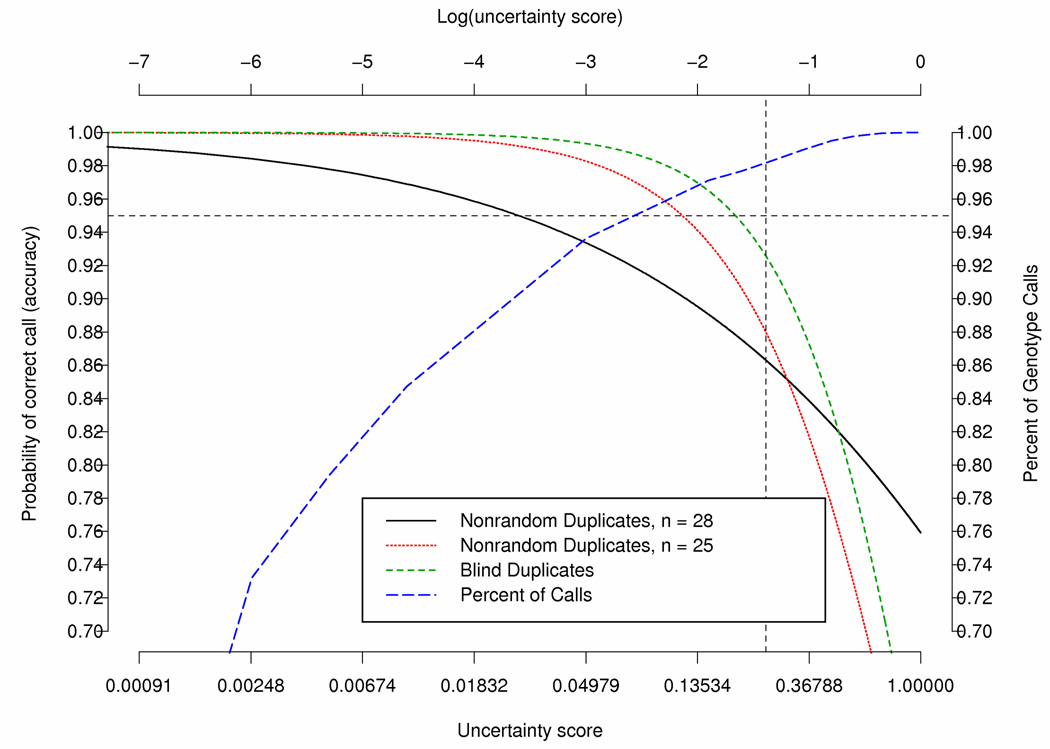
Figure 3.
Predicted probability of accuracy based on latent variable model fitted to data from the blind duplicates and the nonrandom duplicates with and without removing subject e000014, e000106 and e000211; Call Rates for various uncertainty score thresholds based on the blind duplicates. The horizontal line represents a probability of correct call of 0.95 and the vertical line represents an uncertainty score of 0.25.

