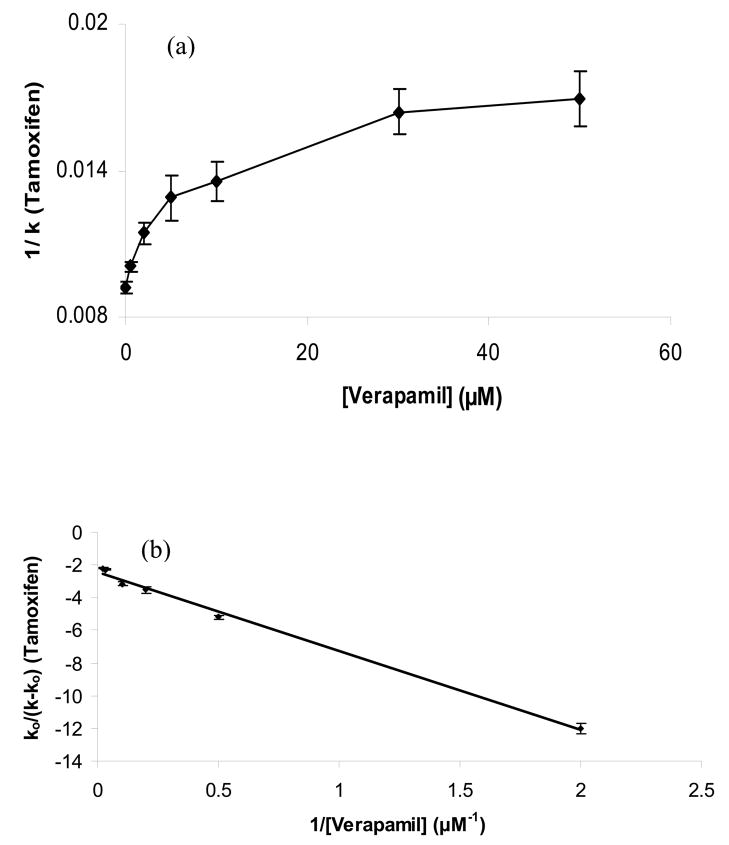
Figure 4.
Zonal elution plots of (a) 1/k versus [Verapamil] according to Eqn. (4) and (b) k0/(k − k0) versus 1/[Verapamil] according to Eqn. (5) for injections of tamoxifen in the presence of mobile phases containing various concentrations of racemic verapamil. The best-fit line in (b) was y = −4.89 (± 0.18) x − 2.42 (± 0.16), with a correlation coefficient of 0.998 (n = 6). The numbers in parentheses and the error bars represent a range of ± 1 SD. These studies were conducted at 37°C in the presence of pH 7.4, 0.067 M phosphate buffer. Other experimental conditions are given in Section 2.3.

