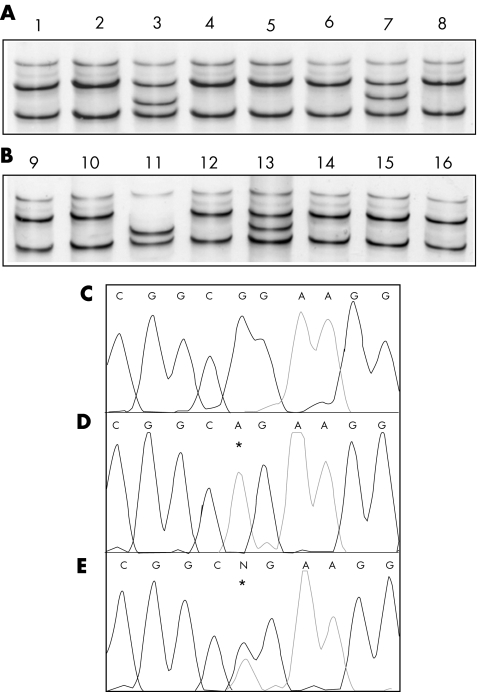
Figure 3 CAPN3 gene mutation analysis in DNA samples from patients with loss of calpain‐3 autolytic activity. Example of SSCP analysis (A, B) showing the aberrant migration pattern (conformer) of samples numbered 3, 7, 11 and 13 as compared with control (number 1). Example of direct DNA sequencing of exon 11 in a normal control (C), in a patient homozygotic for 1469G→A, R490Q missense mutation (D), and in a patient heterozygote for 1469G→A, R490Q missense mutation (E). Asterisks indicate the localisation of mutant nucleotides.

An official website of the United States government
Here's how you know
Official websites use .gov
A
.gov website belongs to an official
government organization in the United States.
Secure .gov websites use HTTPS
A lock (
) or https:// means you've safely
connected to the .gov website. Share sensitive
information only on official, secure websites.
