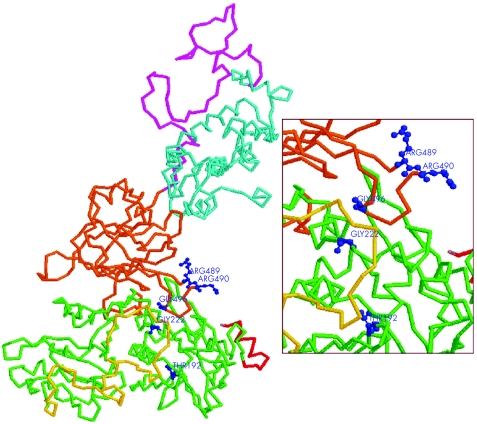
Figure 4 Tridimensional model of calpain‐3 protein showing the functional domains and the localisation of mutant amino acids identified in patients with loss of calpain‐3 autolytic activity. The protein structure is displayed as backbone graphic mode (domain I: red; domain II: green; IS1: yellow; domain III: orange; IS2: magenta; domain IV: cyan), whereas the mutant amino acids are depicted in ball‐and‐stick graphic mode (blue). The enlarged window shows that the amino acids involved in mutations (except T192) are grouped together and localised both at the external surface of the protein and at the contact region between domain II and domain III.

An official website of the United States government
Here's how you know
Official websites use .gov
A
.gov website belongs to an official
government organization in the United States.
Secure .gov websites use HTTPS
A lock (
) or https:// means you've safely
connected to the .gov website. Share sensitive
information only on official, secure websites.
