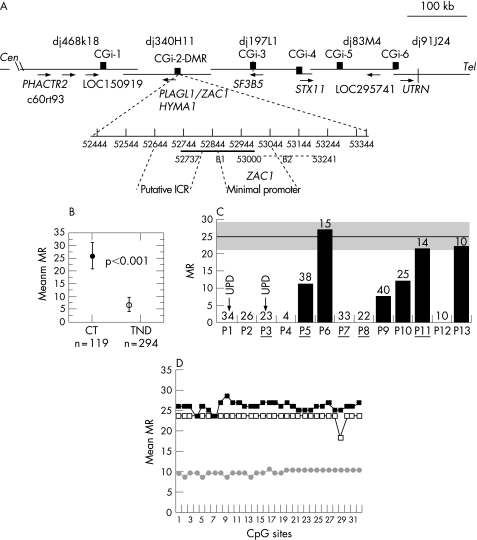
Figure 1 Schematic representation of the 6q24.2 transient neonatal diabetes (TND) locus and methylation analysis of 6q24 differentially methylated region (DMR) in controls and in patients with TND. (A) PAC contig, gene order and direction of transcription (arrows), compiled from http://www.Sanger.ensembl.org,http://www.ncbi.nlm.nih.gov/Entrez/. Black boxes show the physical location of CpG islands (CGi). Positions in GenBank accessions: CGi‐1, 24852–25585 in AL049844; CGi‐2 (DMR) 52444–53375, B1 52737–53000, B2 52976–53241 in AL109755; CGi‐3, 50830–51669 in AL031390; CGi‐4, 3282–4229 in AL512354; CGi‐5, 35362–36232 in AL135917; CGi‐6, 29334–31687 in AL024474. CGi‐2DMR (931 bp) with corresponding positions in AL109755. The ZAC1 transcription start sites are 52907 and 52934,8 and the LOT1 transcription start sites are 52919 and 53080. ICR is the putative imprinting control region5 and ZAC1 the minimal promoter region at which methylation down regulates ZAC1 expression.8 The DMR regions previously analysed are (53085–53362), (52734–53157) and (52977–53241).3,5,6 (B) Overall methylation at the DMR B1 region: methylation ratio (MR) values are shown for control (CT) DNAs (n = 119 clones) and patients with TND (n = 294 clones). p, Fisher's exact test. (C) MRs for individual patients. The arrows indicate patients with paternal uniparental disomy (UPD)6. The number of clones sequenced for each patient is indicated above the bar. The grey area corresponds to the range of control MR values: mean (SEM) MR = 25.9 (5). (D) Quantitative CpG methylation patterns at each CpG site, MR values for pooled clones (Materials and methods), (▪) controls (n = 119), (□) patients with a normal methylation range (n = 38), (•) patients with a partial methylation loss (n = 103); n is the number of sequences analysed.

An official website of the United States government
Here's how you know
Official websites use .gov
A
.gov website belongs to an official
government organization in the United States.
Secure .gov websites use HTTPS
A lock (
) or https:// means you've safely
connected to the .gov website. Share sensitive
information only on official, secure websites.
