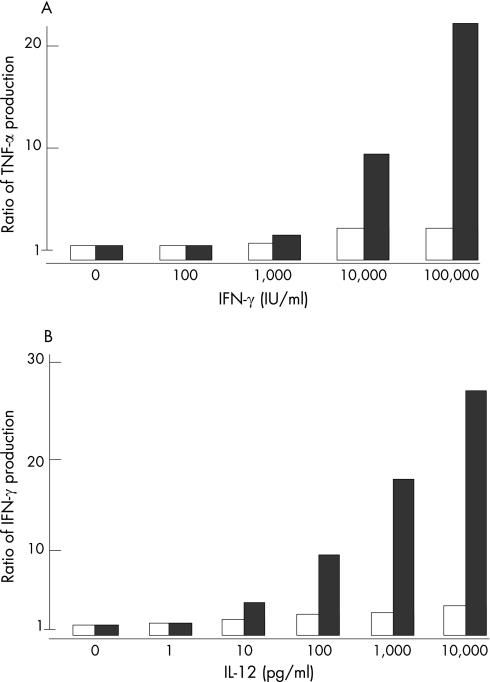
Figure 2 Analysis of cytokine production. (A) CD14‐positive mononuclear cells in the peripheral blood samples of a patient and normal controls were stimulated with LPS and various concentrations of interferon (IFN)‐γ for 48 hours. The purity levels of the CD14‐positive cell populations were >90%. Cell‐culture supernatants were harvested, and the concentrations of tumour necrosis factor (TNF)‐α were measured by Luminex. The data represent the ratios of the levels of TNFα produced in response to LPS plus IFNγ to the levels of TNFα produced in response to LPS alone. Open columns, data from the patient; filled column, representative data from control subjects. (B) CD3‐positive mononuclear cells in the peripheral blood samples of a patient and normal controls were stimulated with purified hemagglutinin (PHA) 1 μg/ml and various concentrations of interleukin (IL)‐12 for 48 hours. The purity levels of CD3‐positive cells populations were >95%. Cell‐culture supernatants were harvested, and the concentrations of IFNγ were measured by Luminex. The data represent the ratios of IFNγ produced in response to PHA plus IL‐12 to the levels of IFNγ produced in response to PHA alone. Open columns, data from the patient; filled columns, representative data from the control subjects.

An official website of the United States government
Here's how you know
Official websites use .gov
A
.gov website belongs to an official
government organization in the United States.
Secure .gov websites use HTTPS
A lock (
) or https:// means you've safely
connected to the .gov website. Share sensitive
information only on official, secure websites.
