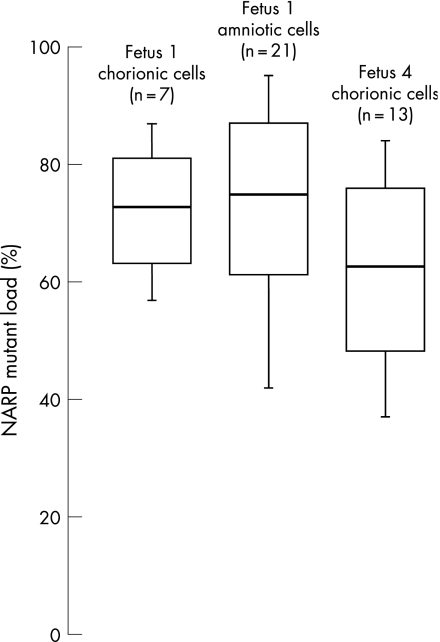
Figure 2 Distribution of cell NARP m.8993T→G mutation levels among embryofetal cells. NARP mutant load was assessed in 7 trophoblastic and 21 amniotic cells from fetus 1 and 13 trophoblastic cells from fetus 4. White bars, tissue averages (central bar) plus (top bar) and minus (lower bar) 1 SD. Vertical bars depict maximum (top) and minimum (bottom) values for each sample.

An official website of the United States government
Here's how you know
Official websites use .gov
A
.gov website belongs to an official
government organization in the United States.
Secure .gov websites use HTTPS
A lock (
) or https:// means you've safely
connected to the .gov website. Share sensitive
information only on official, secure websites.
