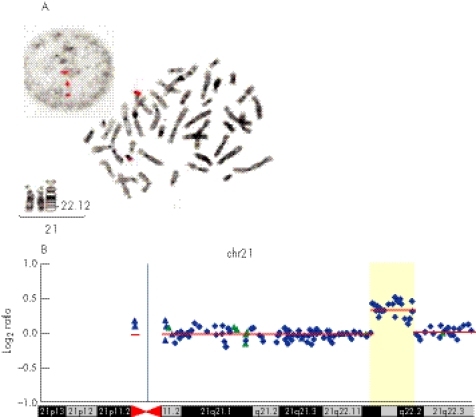
Figure 3 (A) Fluorescent in‐situ hybridisation (FISH) images of the VysisTM locus‐specific probe for chromosome 21 including D21S59, D21S341 and D21S342 on the interphase and metaphase cells of the mother. Partial karyotype of her chromosomes 21 at 550 band resolution. (B) Array comparative genomic hybridization (aCGH) profile of chromosome 21 assayed on the RPCI 19K bacterial artificial chromosome (BAC) array demonstrating duplication at megabase pairs 36–40.3. Average log2 ratios (y axis) were plotted for all clones based on the chromosomal position (x axis), with the blue bar demarcating the centromere. Regions of normal segmental duplications are represented by blue and green triangles, and can be found at http://genome.ucsc.edu/cgi‐bin/hgGateway and http://projects.tcag.ca/variation/, respectively. Horizontal red lines indicate the log2 ratio for each segment as segmented by circular binary segmentation.

An official website of the United States government
Here's how you know
Official websites use .gov
A
.gov website belongs to an official
government organization in the United States.
Secure .gov websites use HTTPS
A lock (
) or https:// means you've safely
connected to the .gov website. Share sensitive
information only on official, secure websites.
