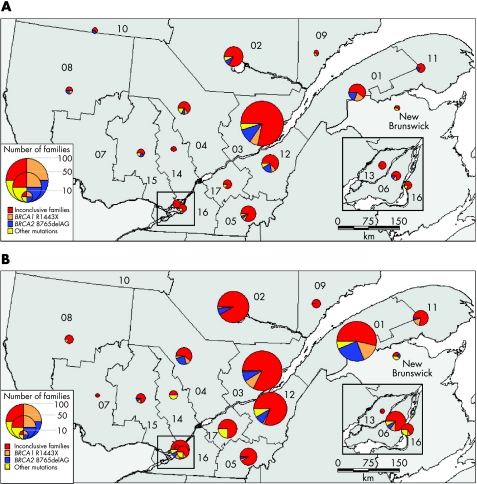
Figure 3 (A) Place of residence of index cases in the Quebec territory (n = 251) and (B) place of marriage of genealogical probands' grandparents (n = 465). The size of the circles is proportional to the number of high‐risk families recruited in each of the regions. Parts in the pies represent, for each region, the proportion of families harbouring one of the two founder mutations (BRCA1, orange; BRCA2, blue), another BRCA mutation (yellow) or for whom testing was inconclusive (red). Numbers on the map represent the following regions: (01) Bas St‐Laurent, (02) Saguenay‐Lac‐St‐Jean, (03) Quebec, (04) Mauricie, (05) Estrie, (06) Montreal, (07) Outaouais, (08) Abitibi‐Témiscamingue, (09) Côte‐Nord, (10) Nord‐du‐Québec, (11) Gaspésie‐Îles‐de‐la‐Madeleine, (12) Chaudière‐Appalaches, (13) Laval, (14) Lanaudière, (15) Laurentides, (16) Montérégie, (17) Centre‐du‐Québec. The Greater Montreal area (regions 06, 13 and 16) is enlarged in the insets. Other BRCA mutations identified by yellow sections in the pies indicate other mutations identified in (01) BRCA1: 2244insA; (02) BRCA1: 2244insA and 5221delTG; (03) BRCA1: 2080insA and 2953 delGTAinsC, BRCA2: 3034delAAAC and 8904delA; (04) BRCA2: 2816insA and R3128X; (05) BRCA1: 3705insA; (12) BRCA1: 2244insA, BRCA2: 6503delTT; (15) BRCA1: 4160delAG; (16) BRCA1: 2953 delGTAinsC; (17) BRCA1: E352X; New Brunswick BRCA1: 1623delTTAAA. The Statistics Canada population census of these regions of Quebec and New Brunswick for 2001 was (01) 200 630; (02) 278 279; (03) 638 917; (04) 255 268; (05) 285 613; (06) 1 812 723; (07) 315 546; (08) 146 097; (09) 97 766; (10) 38 575; (11) 96 924; (12) 383 376; (13) 343 005; (14) 388 495; (15) 461 366; (16) 1 276 397; (17) 218 502; New Brunswick, 749 900.

An official website of the United States government
Here's how you know
Official websites use .gov
A
.gov website belongs to an official
government organization in the United States.
Secure .gov websites use HTTPS
A lock (
) or https:// means you've safely
connected to the .gov website. Share sensitive
information only on official, secure websites.
