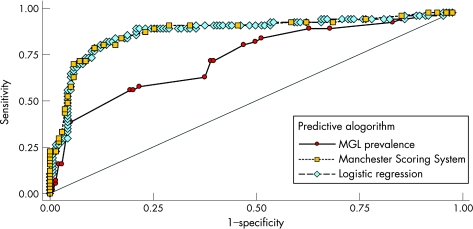
Figure 5 Receiver operating characteristic analysis of three BRCA1/BRCA2 mutation prediction algorithms showing sensitivity (ie, proportion of families with a BRCA1/BRCA2 mutation with a score or probability greater than or equal to a given threshold) plotted against 1−specificity (ie, proportion of families with scores below the threshold without an identified BRCA1/BRCA2 mutation). One point on the curve is obtained for each possible threshold. The area under the curve is used as a measure of the adequacy of the criteria used for genetic testing. MGL, Myriad Genetics Laboratories.

An official website of the United States government
Here's how you know
Official websites use .gov
A
.gov website belongs to an official
government organization in the United States.
Secure .gov websites use HTTPS
A lock (
) or https:// means you've safely
connected to the .gov website. Share sensitive
information only on official, secure websites.
