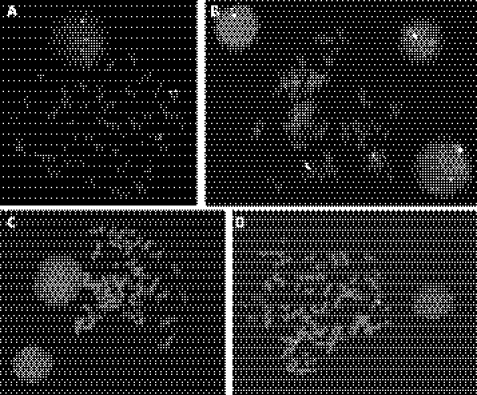
Figure 4 (A) Fluorescence in situ hybridisation (FISH) results for patient 41A performed with the William–Beuren syndrome (WBS) probe LSI ELN (Vysis). The ELN probe (orange signal) is labelled with Spectrum Orange dUTP and LSI D7S486, D7S522 (green signal) is labelled with spectrum green dUTP. (B) FISH results for patient 41A performed with the SGI BAC RP11‐89A20 (green) labelled with spectrum green dUTP, and the control probe for the 7q subtelomere (orange, TelVysion 7q (Vysis)) labelled with spectrum orange dUTP. A normal green signal and a second weaker green signal (indicated with arrowheads) of varying intensity are observed on both metaphase chromosomes and interphase nuclei. Control probe signals appear equal in intensity on both chromosomes 7. (C, D). FISH results for the father and mother, respectively, of patient 41A, performed with the SGI BAC RP11‐89A20 (green) labelled with spectrum green dUTP, and the control probe for the 7q subtelomere (orange, TelVysion 7q (Vysis)) labelled with spectrum orange dUTP. Two normal green signals are observed, and control probe signals are also of equal intensity on both chromosomes 7.

An official website of the United States government
Here's how you know
Official websites use .gov
A
.gov website belongs to an official
government organization in the United States.
Secure .gov websites use HTTPS
A lock (
) or https:// means you've safely
connected to the .gov website. Share sensitive
information only on official, secure websites.
