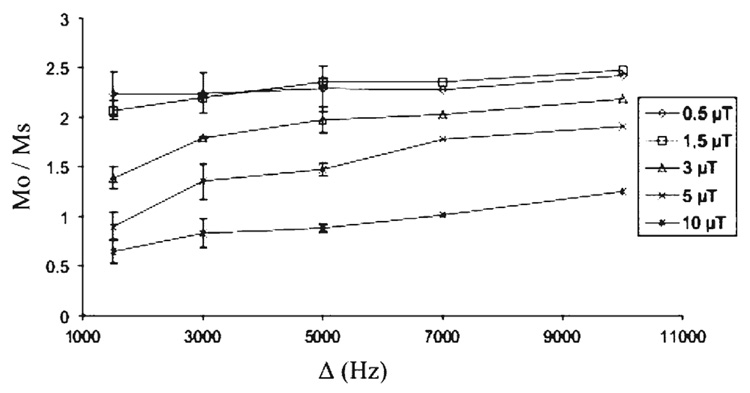
Fig. 3.
Evolution of the ratio Mo/Ms within the corpus callosum of healthy mice for five values of amplitude B1 (0.5, 1.5, 3, 5 and 10 µT) combined to five values of offset frequency Δ (1.5, 3, 5, 7 and 10 kHz) of the saturation pulse. MO and MS are the magnitude of signal without and with MT saturation. Note that the higher Mo/Ms values are reached for B1 of 1.5 µT and Δ of 5–10kHz

