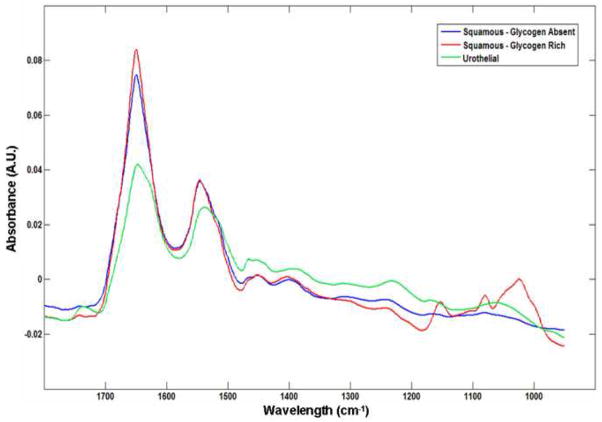
Fig. 4.
Mean second derivative spectra of the three epithelial cell types: glycogen-rich (red) and glycogen-free (blue) squamous epithelial cells, urothelial epithelial cells (green). The bands marked by asterisks are due to glycogen, whereas the band marked by (‡) is typical for phospholipids. The spectral region A displays the amide due to nucleic acids and phospholipids.

