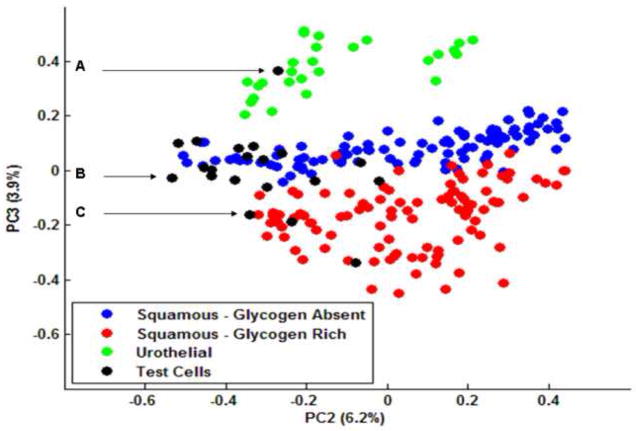
Fig. 7.
Three of the cells that serviced as input for the spectroscopic diagnosis test. The infrared spectrum recorded from each cell is displayed with its respective photomicrograph. Cells A – C correlate to the three test cells displayed in Figure 6.

