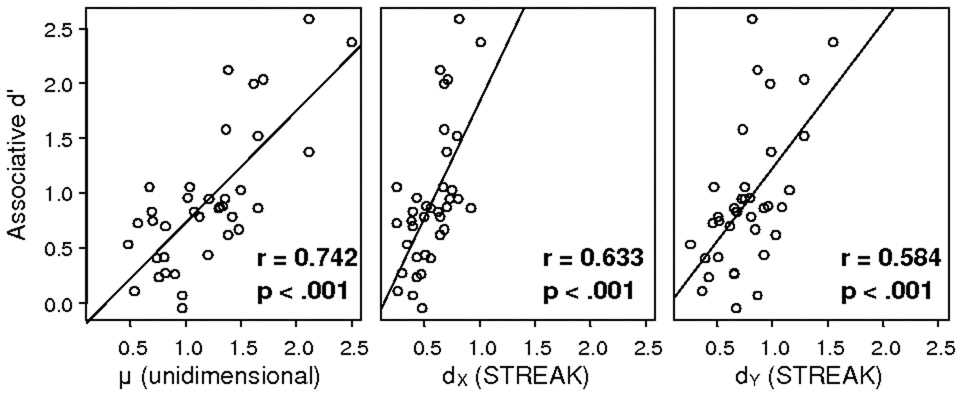
Figure 6.
Relationship between the memory strength parameters and associative recognition performance. The first plot shows results for the mean of the target evidence in the univariate model (µ), the second shows results for the global strength estimate from STREAK (dX), and the third shows results for the specific strength estimate from STREAK (dY). Correlation coefficients and associated p-values appear in the bottom right corner of each plot.

