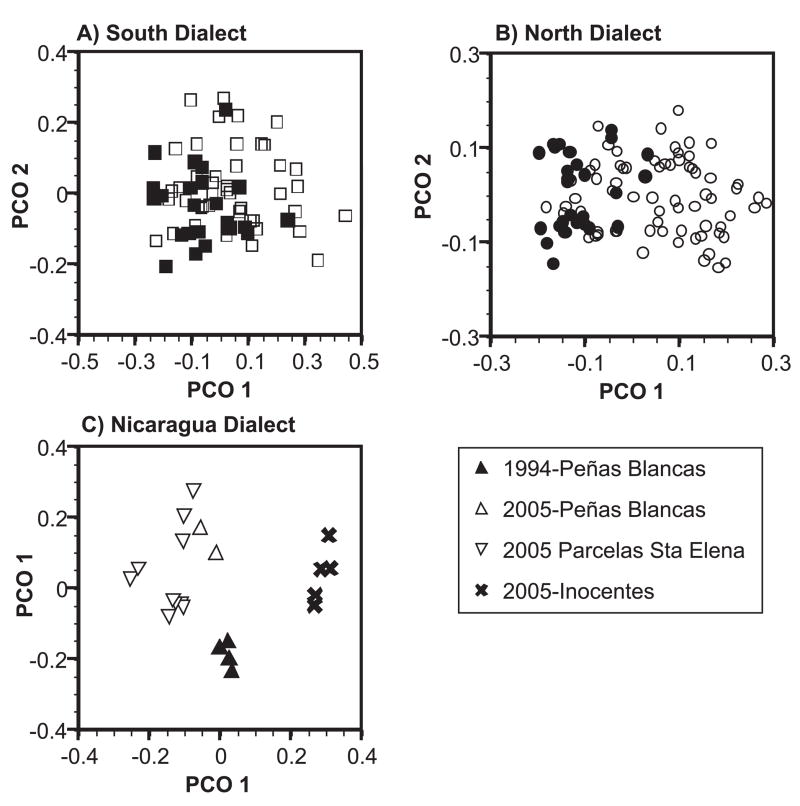
Figure 5.
Plots of the first and second PCO eigenvectors of the peak spectrogram cross-correlation values for calls from the a) South, b) North, and c) Nicaraguan dialects. Points indicate the mean values for the calls of an individual (South = 67 individuals, North = 96 individuals, Nicaraguan = 21 individuals). In a) and b), closed symbols indicate individuals from 1994 and open symbols individuals from 2005. In c) points follow the accompanying legend.

