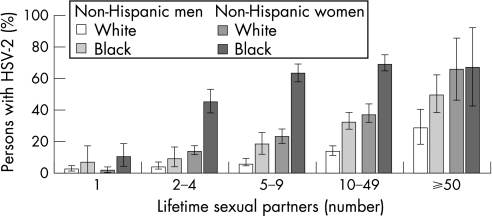
Figure 15 Age‐adjusted herpes simplex virus type 2 (HSV‐2) seroprevalence according to the lifetime number of sex partners by race/ethnicity and sex on the National Health and Nutrition Examination Survey (NHANES) in 1999–2004. Note: Error bars indicate 95% confidence intervals. Source: Xu et al.44

An official website of the United States government
Here's how you know
Official websites use .gov
A
.gov website belongs to an official
government organization in the United States.
Secure .gov websites use HTTPS
A lock (
) or https:// means you've safely
connected to the .gov website. Share sensitive
information only on official, secure websites.
