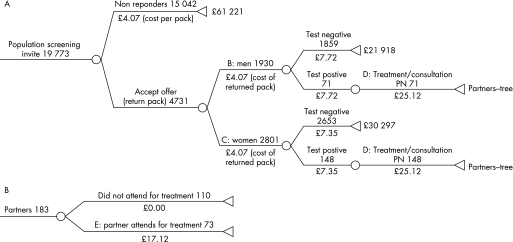
Figure1 Index patient pathway. (A) Index patients. (B) Sexual partners. For each branch option, the number of patients who flowed through that branch is above the line and the unit cost is below. The aggregated costs of each stage are shown by the following letters: A, cost per screening invitation; B, cost per screening test in men; C, cost per screening test in women; D, cost of treatment per index case, including partner notification; and E, cost of treatment per sexual partner. PN, partner notification.

An official website of the United States government
Here's how you know
Official websites use .gov
A
.gov website belongs to an official
government organization in the United States.
Secure .gov websites use HTTPS
A lock (
) or https:// means you've safely
connected to the .gov website. Share sensitive
information only on official, secure websites.
