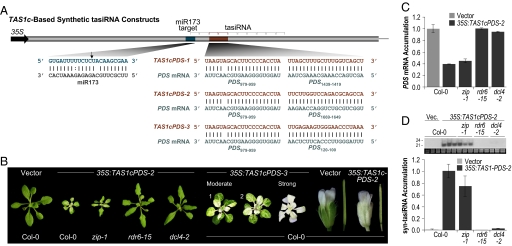
Fig. 1.
Syn-tasiRNA. (A) Organization of syn-tasiRNA constructs. Arrow indicates the miR173-guided cleavage site. tasiRNA positions 3′D1(+) through 3′D10(+) are indicated by brackets. (B) Representative images of Col-0 and mutant plants expressing syn-tasiRNA constructs. (C) Mean relative level +/− SEM of PDS mRNA after normalization to ACT2 mRNA, as determined by quantitative RT-PCR (Col-0 vector = 1.0). (D) Mean relative level +/− SEM of syn-tasiRNA as determined by blot assays (Col-0 35S:TAS1cPDS-2 = 1.0). (Inset) Small RNA blot and EtBr-stained 5S rRNA/tRNA.

