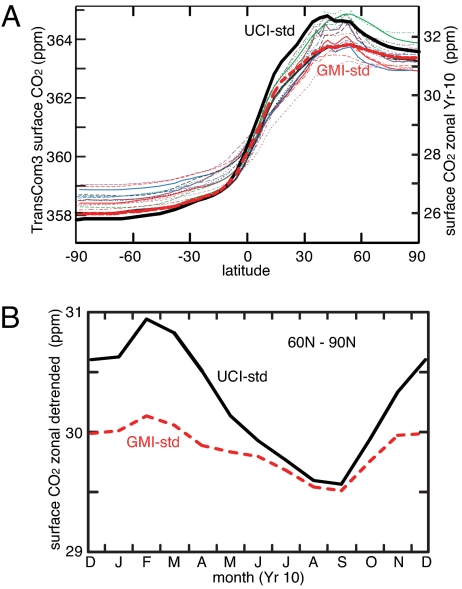
Fig. 1.
Modeled surface abundances of CO2. (A) Zonal mean, surface (Layer = 1) CO2 abundance (ppm = micromoles per mole) calculated by CTMs from surface fossil-fuel emissions. The range of thin colored lines (left axis) are from the TransCom3 study (figure 3 of ref. 24) for the final year of an experiment beginning with 1990 emissions and ending with 1995 emissions (21). From this study (right axis), the UCI CTM (thick black line) and GMI CTM (thick red dashed line) show the Year-10 means following uniform emissions of the 1995 fossil fuel CO2 emissions (2.92 ppm per year). (B) The detrended seasonal variation of high-latitude (60°N–90°N) surface CO2 from Year 10 of this study with the UCI and GMI CTMs.

