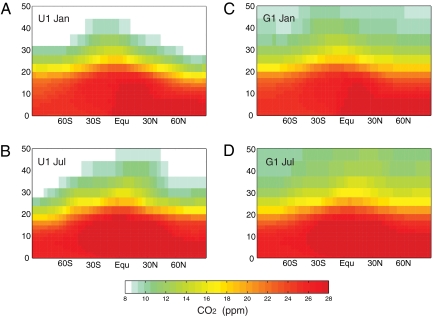
Fig. 2.
Latitude × height color plots of zonal mean CO2 abundance (ppm) from GMI and UCI CTMs. (A and B) January (A) and July (B) from Year 10 of UCI advection-only CTM at standard resolution (U1). (C and D) January (C) and July (D) from Year 10 of GMI advection-only CTM at standard resolution (G1).

