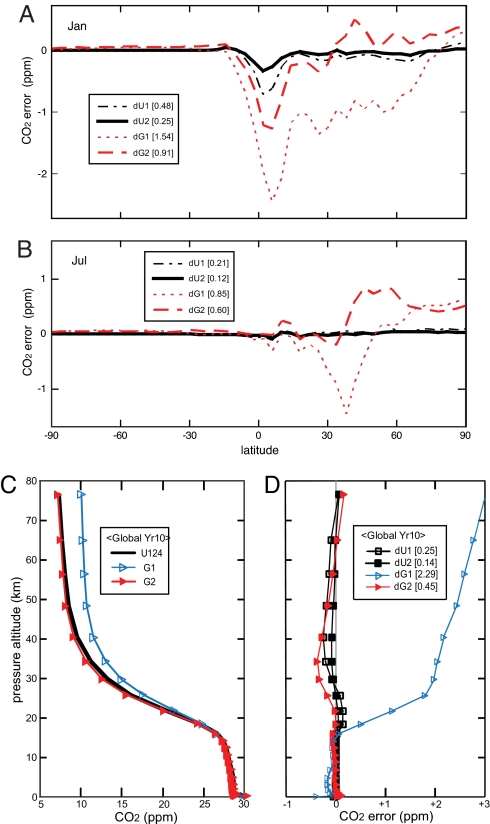
Fig. 4.
Errors in the original (G1, U1) and doubled resolution (G2, U2). (A and B) Latitude pattern of zonal mean errors of the monthly average surface CO2 for January (A) and July (B) of Year 10. Errors are calculated with respect to Uext (see Fig. 3). Results are shown for U1 (thin dashed-dotted black line), U2 (thick solid black line), G1 (thin short-dashed red line), and G2 (thick long-dashed redline). The rms, area-weighted difference (ppm) for each model is given in the legend. (C) Altitude profiles of the Year 10, annual-average, area-weighted global-mean CO2 profiles (ppm) for U1, U2, U4 (thick black line, indistinguishable), G1 (thin blue line, open triangles), and G2 (thin red line, filled triangles). (D) Altitude profile of the errors in these curves (see Fig. 3): dU1 (black open squares), dU2 (black filled squares), dG1 (blue open triangles), and dG2 (red filled triangles). Markers represent the middle of layers in the standard resolution CTM. The rms errors (ppm) of the latitude × altitude annual zonal mean are given in the legend.

