
Figure 2.
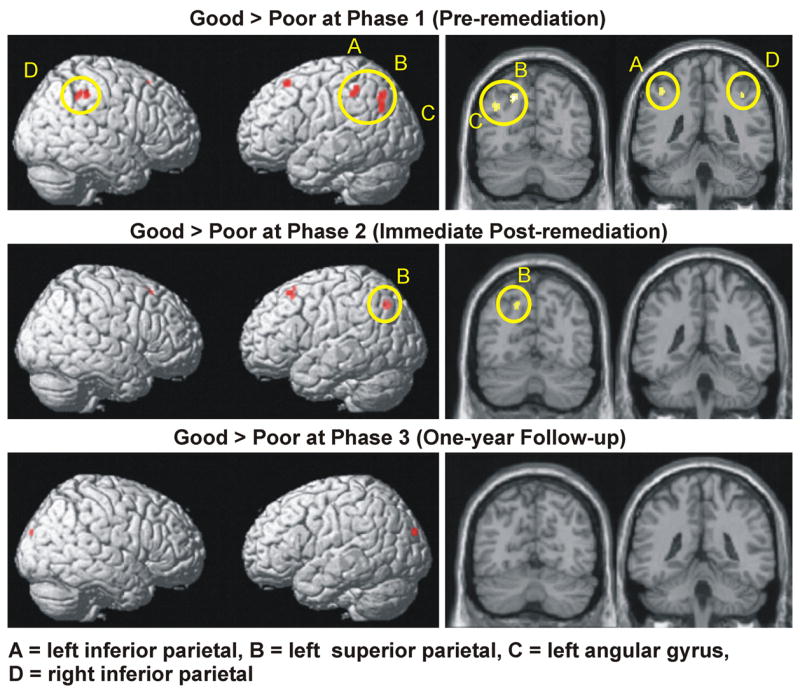
Brain areas showing greater activation among good readers vs. poor readers at each phase of the study. The same data are presented overlaid on a surface rendering (right column) and overlaid on individual coronal slices (left column) of the normalized Montreal Neurological Institute canonical brain. Yellow ovals encircle parietal activation.