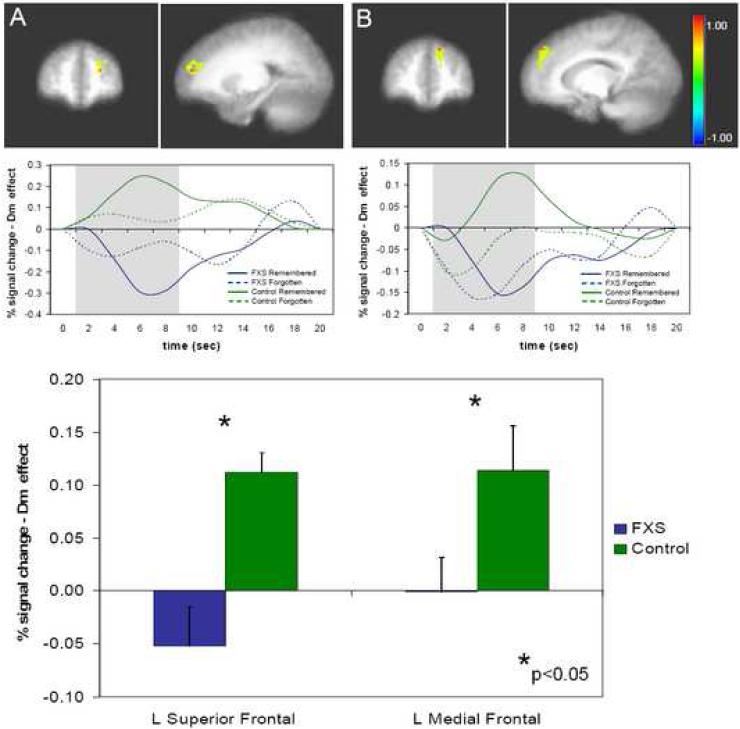
Figure 3.
Regions of interest in the FXS vs. control comparison of the Dm effect in which the control group showed greater activation than the FXS group (after accounting for variance associated with age and IQ). A: Left Superior Frontal gyrus (BA 10; -20,48,15), B: Left Medial Frontal gyrus (BA 8; -11,45,38) (images presented according to radiological convention, in which the right hemisphere is depicted on the left side of the coronal image). Averaged MR time series are presented below for each region for the 20 seconds following stimulus onset: FXS group - subsequently remembered (blue solid line), FXS group - subsequently forgotten (blue dashed line), Control group - subsequently remembered (green solid line), Control group - subsequently forgotten (green dashed line). Shaded portion of averaged time series indicates the section of the time series for which the percent signal change (for the Dm effect: subsequently remembered - subsequently forgotten) was extracted for graphing below.

